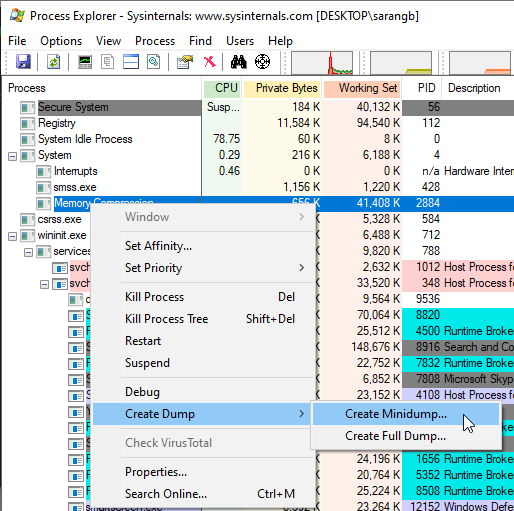
Process explorer has a pretty cool functionality about generating process dumps. It has two types of dumps: mini and full. Now the full dump generates a massive dmp file and encodes all the process memory, but often that is not really required (for various reasons), but more importantly the helpful information is about threads and handles.
Microsoft provides the API for generating dumpfiles programmatically, MiniDumpWriteDump . Now the key to write a dump is to OpenProcess with appropriate access.
To generate a dump file, then all you need is to:
- open process with appropriate access
- specify the minidump options
| |
In all of this key thing is to specify the dumpOpts correctly. One of the ways to ascertain the options is to look at what process explorer generated. For that open the dumpfile in windbg (windbg -z memory.dmp) and execute command .dumpdebug. It will produce following output (trimmed in this case).
The header just contains the flags as provided to MiniDumpWriteDump, this does not necessarily means that requested data is written in the dump file.
| |
Followed by various streams as captured in dump. The stream types are defined in DbgHelp.h/minidumpapiset.h
The size of streams seems like it is in bytes, 364 vs 18 threads.
| |
The flags passed are 0x1105. Now if you have just open the process with PROCESS_ALL_ACCESS (0x1FFFF), you will get the handle data in dumpfile. Once you have generated the dump file open in windbg again and check with !handle command. It should list handles from dump if it could capture else it will just provide you with some error message.
| |
more on this in next post
Entire code is along these lines:
| |
links of interest:Links of interest (click to expand..)