Reference: AppVerifier Locks This is more of a dump from various pages of MSDN for handy reference.
A few links i have found useful over time are:
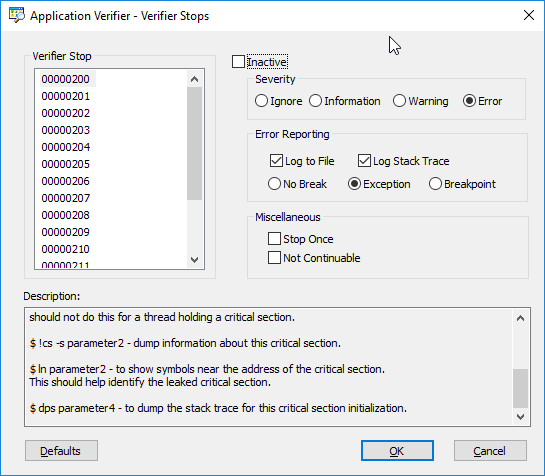
200:
This stop is generated if a thread (thread ID is parameter1) is terminated, suspended or is in a state worker thread finished a work item) in which it cannot hold a critical section. The current thread is the culprit. To debug this stop use the following debugger commands:
$ kb- to get the current stack trace. If the current thread is the owner of the critical section it is probably callingExitThread. The current thread should have released the critical section before exiting. If the current thread is callingTerminateThreadorSuspendThreadthen it should not do this for a thread holding a critical section.$ !cs -s parameter2- dump information about this critical section.$ ln parameter2- to show symbols near the address of the critical section. This should help identify the leaked critical section.$ dps parameter4- to dump the stack trace for this critical section initialization.
201:
This stop is generated if a DLL has a global variable containing a critical section and the DLL is unloaded but the critical section has not been deleted. To debug this stop use the following debugger commands:
$ du parameter3- to dump the name of the culprit DLL.$ .reload dllnameor.reload dllname = parameter4- to reload the symbols for that DLL.$ !cs -s parameter1- dump information about this critical section.$ ln parameter1- to show symbols near the address of the critical section. This should help identify the leaked critical section.$ dps parameter2- to dump the stack trace for this critical section initialization.
202:
This stop is generated if a heap allocation contains a critical section, the allocation is freed and the critical section has not been deleted. To debug this stop use the following debugger commands:
$ !cs -s parameter1- dump information about this critical section.$ ln parameter1- to show symbols near the address of the critical section. This should help identify the leaked critical section.$ dps parameter2- to dump the stack trace for this critical section initialization.$ parameter3and parameter4 might help understand where this heap block was allocated (the size of the allocation is probably significant).
203:
Usually this stop is generated if a critical section has been initialized more than one time. In this case parameter3 and parameter4 are the stack trace addresses for two of these initializations. Some other times it is possible to get this stop if the critical section or its debug information structure has been corrupted. In this second case it is possible that parameter3 and parameter4 are invalid and useless. To debug this stop:
$ !cs -s -d parameter2- dump information about this critical section.$ ln parameter1- to show symbols near the address of the critical section. This might help identify the critical section if this is a global variable.$ dps parameter3anddps parameter4- to identify the two code paths for initializing this critical section.
204:
This stop is generated if the memory containing a critical section was freed but the critical section has not been deleted using DeleteCriticalSection. To debug this stop use the following debugger commands:
$ !cs -s -d parameter2- dump information about this critical section.$ dps parameter3- to identify the code path for initializing this critical section.
In most cases the lock verifier detects immediately leaked critical sections contained in a heap allocation, a DLL range, a virtual memory allocation or a MapViewOfFile mapped memory range and issues different stops in these cases. So there are very few cases left for this verifier stop. The lock must be in a memory range freed by kernel-mode code or freed cross-process by APIs like VirtualFreeEx. Most typically this stop will be encountered if a previous stop (e.g. LOCK_IN_FREED_HEAP or LOCK_IN_UNLOADED_DLL) was continued by hitting g in the debugger console.
205:
This stop is generated if the DebugInfo field of the critical section is pointing freed memory. Usually another valid DebugInfo structure is found in the active critical section list. Without corruption the two pointers should be identical. To debug this stop use the following debugger commands:
$ !cs -s -d parameter3- dump information about this critical section based on the current contents of the debug info structure found in the active list (this structure is rarely corrupted so usually this information is trustworthy).$ !cs -s parameter1- dump information about this critical section based on the current contents of the critical section structure (the structure is corrupted already so sometimes this information is NOT trustworthy).$ dps parameter4- to identify the code path for initializing this critical section.
Dump the critical section at address parameter1 and look for the corruption pattern. With good symbols for ntdll.dl you can use the following commands:
$ dt ntdll!_RTL_CRITICAL_SECTION LOCK_ADDRESS$ dt ntdll!_RTL_CRITICAL_SECTION_DEBUG DEBUG_ADDRESS
206:
This stop is generated if the owner thread ID is invalid in the current context. For example, the critical section is being released by a thread other than the one that acquired it. To debug this stop:
$ !cs -s parameter1- dump information about this critical section.$ ln parameter1- to show symbols near the address of the critical section. This should help identify the critical section.
207:
This stop is generated if the recursion count field of the critical section structure is invalid in the current context. To debug this stop:
$ !cs -s parameter1- dump information about this critical section.$ ln parameter1- to show symbols near the address of the critical section. This should help identify the critical section.
208:
This stop is generated if a critical section is owned by a thread if it is deleted or if the critical section is uninitialized. To debug this stop:
$ !cs -s parameter1- dump information about this critical section. If the owning thread is 0 the critical section has not been initialized.$ ln parameter1- to show symbols near the address of the critical section. This should help identify the critical section.
209:
This stop is generated if a critical section is released more times than the current thread acquired it. To debug this stop:
$ !cs -s parameter1- dump information about this critical section.$ !cs -s -d parameter4- dump information about this critical section.$ ln parameter1- to show symbols near the address of the critical section. This should help identify the critical section.
210:
This stop is generated if a critical section is used without being initialized or after it has been deleted. To debug this stop:
$ ln parameter1- to show symbols near the address of the critical section. This should help identify the critical section.
211:
This stop is generated if a critical section is reinitialized by the current thread. To debug this stop:
$ !cs -s parameter1or!cs -s -d parameter2- dump information about this critical section.$ ln parameter1- to show symbols near the address of the critical section.
This might help identify the critical section if this is a global variable.
212:
This stop is generated if the current thread is calling VirtualFree on a memory block that contains an active critical section. The application should call DeleteCriticalSection on this critical section before if frees this memory.
$ kb- to display the current stack trace, that is calling VirtualFree. The probable culprit is the DLL that calls VirtualFree.$ !cs -s parameter1- dump information about this critical section.$ dps parameter2- to identify the code path for the initialization of this critical section.
213:
This stop is generated if the current thread is calling UnmapViewOfFile on a memory block that contains an active critical section. The application should call DeleteCriticalSection on this critical section before if unmaps this memory.
$ kb- to display the current stack trace, that is callingUnmapViewOfFile. The probable culprit is the DLL that callsUnmapViewOfFile.$ !cs -s parameter1- dump information about this critical section.$ dps parameter2- to identify the code path for the initialization of this critical section.
214:
This stop is generated if the current thread is calling LeaveCriticalSection but, according to the internal verifier bookkeeping, it doesn’t own any critical section.
If parameter2 is zero, probably this is a bug in the current thread.
It either tries to leave a critical section that it didn’t enter, or maybe it is calling LeaveCriticalSection more times than it called EnterCriticalSection for the same critical section.
215:
This stop is generated if the current thread tries to use a private lock that livesinside another DLL. For example a.dll tries to enter a critical section defined inside ntdll.dll. Private locks cannot be used across DLLs.